
Why Engineers Must Care About Product-Market Fit (And How To Do It)
Engineering Is About Building Products That People Love

You can build the most elegant, scalable system in the world, but if nobody uses the product, what’s the point?
While you can say this is a business or product management concern, it’s also an engineering challenge.
Our work is wasted if users don’t find value in what we build. If we fail to measure and iterate on user adoption, we risk shipping features that never gain traction.
Considering Product-Market Fit (PMF) means considering the bigger picture. It means asking questions like:
Does what we’re building actually matter to users? Are we solving a real problem in a way that keeps them coming back?
Let’s look at how to connect your engineering work to real product outcomes by understanding Product-Market Fit and using tools and techniques to measure key metrics.
Is What We’re Building Actually Resonating with Users?
Product-market fit is the moment when a product clicks with the market. This happens when users adopt it and love it enough to keep using it, pay for it, and recommend it to others.
It means to have:
✅ High engagement – Users actively interact with key features.
✅ Strong retention – They keep coming back over time.
✅ Organic growth – People share it with others.
✅ Low churn – Users don’t abandon it after a few tries.
✅ Feature adoption – New capabilities are actually used, not just shipped.
The engineering challenge in PMF is going beyond tracking traditional engineering metrics by holistically assessing the end-to-end user experience:
⚙️ Every technical decision—architecture, performance optimizations, feature prioritization—affects how easily users can adopt and engage with the product.
📉 If we don’t measure how users interact with what we build, we risk shipping features that get ignored or frustrate users. Without data, we’re just guessing what’s working.
3 Techniques for Collecting and Analyzing PMF Data
Luckily, PMF is reasonably easy to measure and validate with data. However, not all data is useful. Too often, teams track vanity metrics (like how many times a sign-up page was displayed) instead of real indicators of product adoption, retention, and engagement.
1. User Behavior Tracking: Are People Using What We Build?
🎯 Why This Matters
Building a project just for the sake of building it happens very rarely. Most of the time, we want other people, aka users, to use it. While as engineers, we are excellent at shipping features, we, at the same time, need to make the next step and measure if users engage with them.
The engagement consists of users discovering the feature, actively using (or abandoning) it, and converting in ways we expect them to.
📈 How to Measure It
The first step in any analytics is telemetry instrumentation. For PMF, this can be any event-based analytics tool, such as Amplitude, which allows tracking of how users interact with our product.
Then, we need to define key user actions to track, such as "User completed onboarding", "User enabled notifications", or "User saved first document".
In Amplitude, tracking these events from code is as simple as (for JavaScript version):
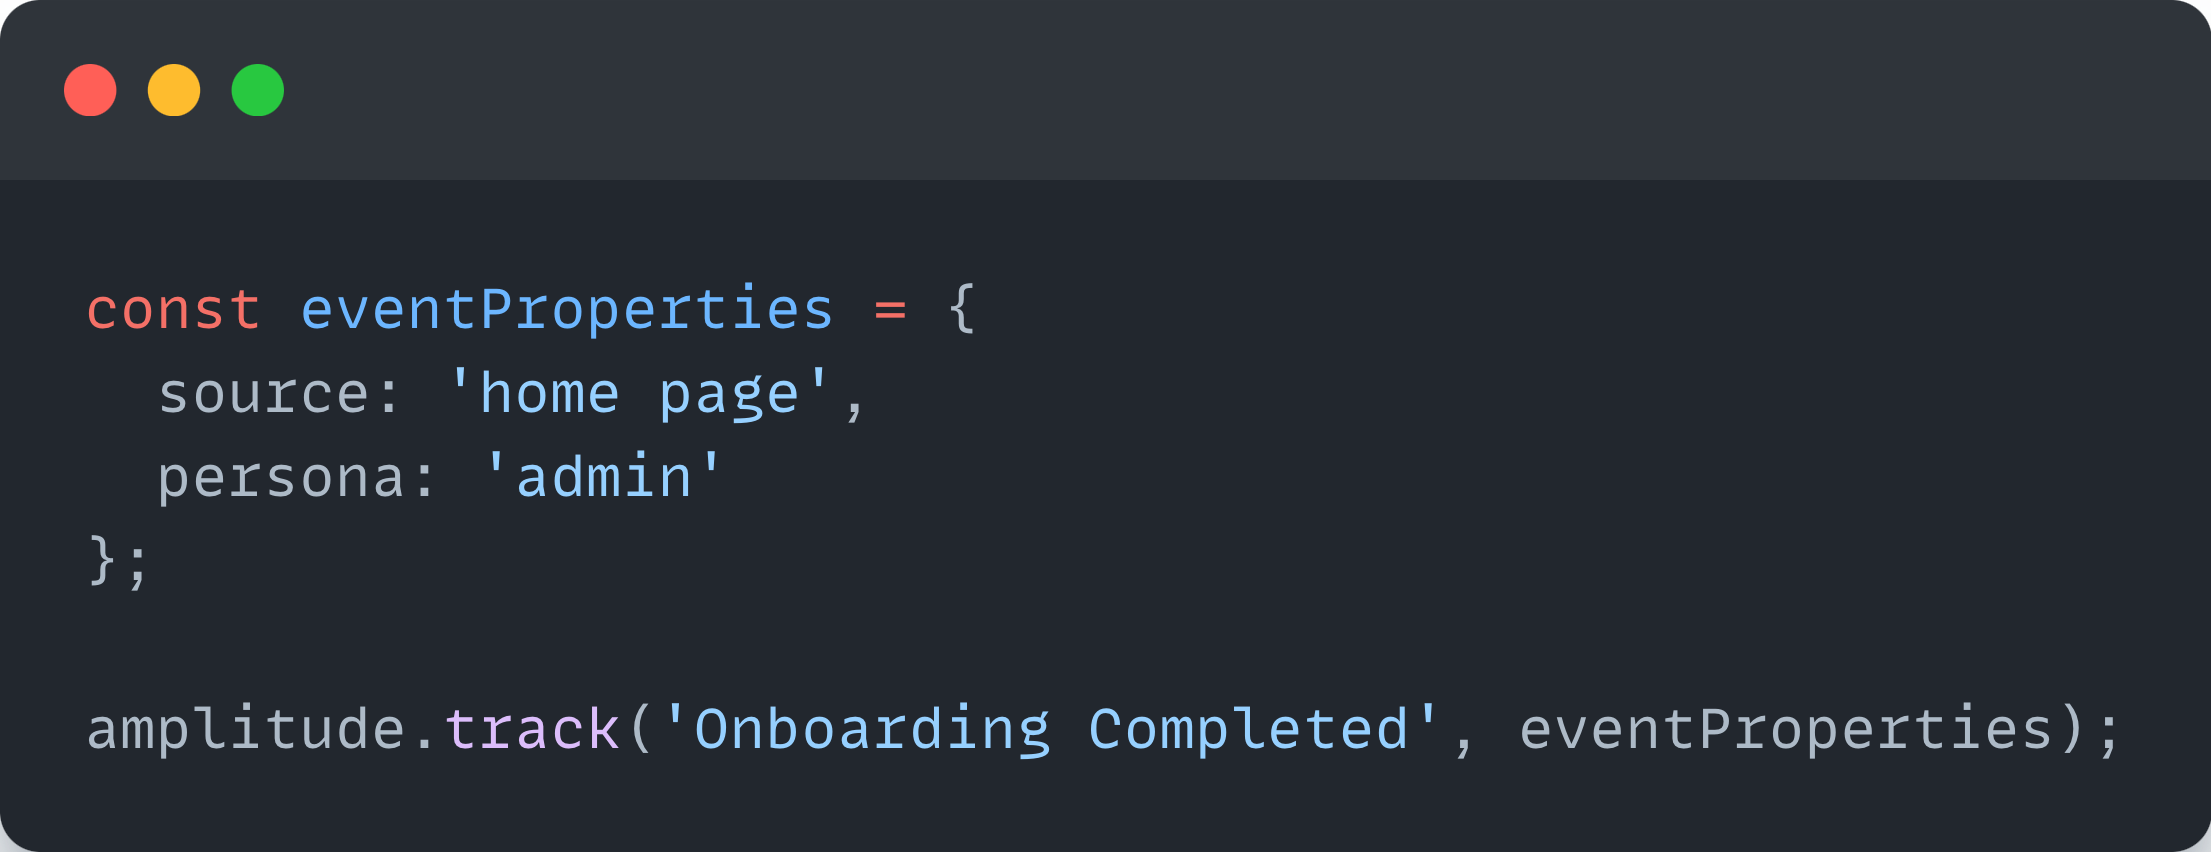
With event data being sent to the analytics tool, we can build and track conversion funnels to see where users drop off. For the event above, it can be: Signup → Onboarding started → Onboarding finished.
Here is an example of how a ticket purchasing funnel might end up looking:
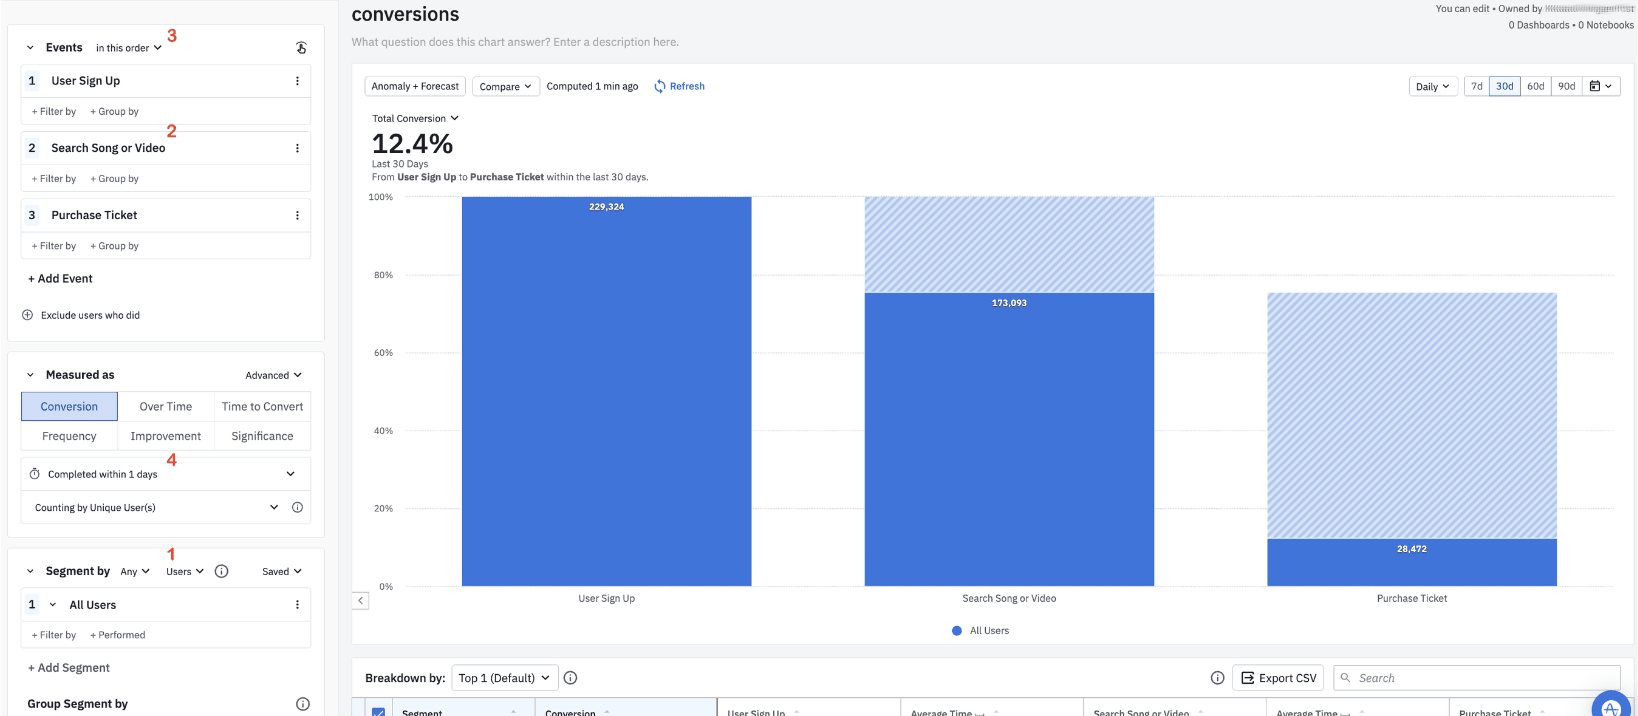
With such funnels in place, we can ask questions like:
Which step has the biggest drop-off in the funnel?
How can we improve the UX in that step so users can continue the flow?
Give the current conversion, is the feature viable?
An effective strategy while developing a feature is to A/B test several variants of its user experience. For this, I recommend LaunchDarkly, which I’ve been using for several years now (they also offer a free Developer tier).
Combining feature flags and funnel analysis helps find the optimal experience that allows users to navigate through desired flows effectively.
💡 Actionable Tip
Before shipping any major feature, apart from defining events and funnels, define one key metric that will measure its success. For example:
If you are launching a new onboarding flow, track the Time to First Action to see if users learn the product more easily and engage more quickly.
If you are rolling out an AI-powered search, measure the Search Completion Rate to see if results are relevant.
2. Retention & Engagement: Do Users Keep Coming Back?
🎯 Why This Matters
A one-time user is a failed experiment. Many products attract an initial wave of users through marketing, getting viral, or curiosity about a new feature. But it means nothing if they don’t stick around.
Retention is the ultimate validation of Product-Market Fit (PMF) because it signals that users see sustained value over time, not just a one-time novelty.
📈 How to Measure It
Retention is often visualized as a curve over time tracking the percentage of users who return after their first visit.
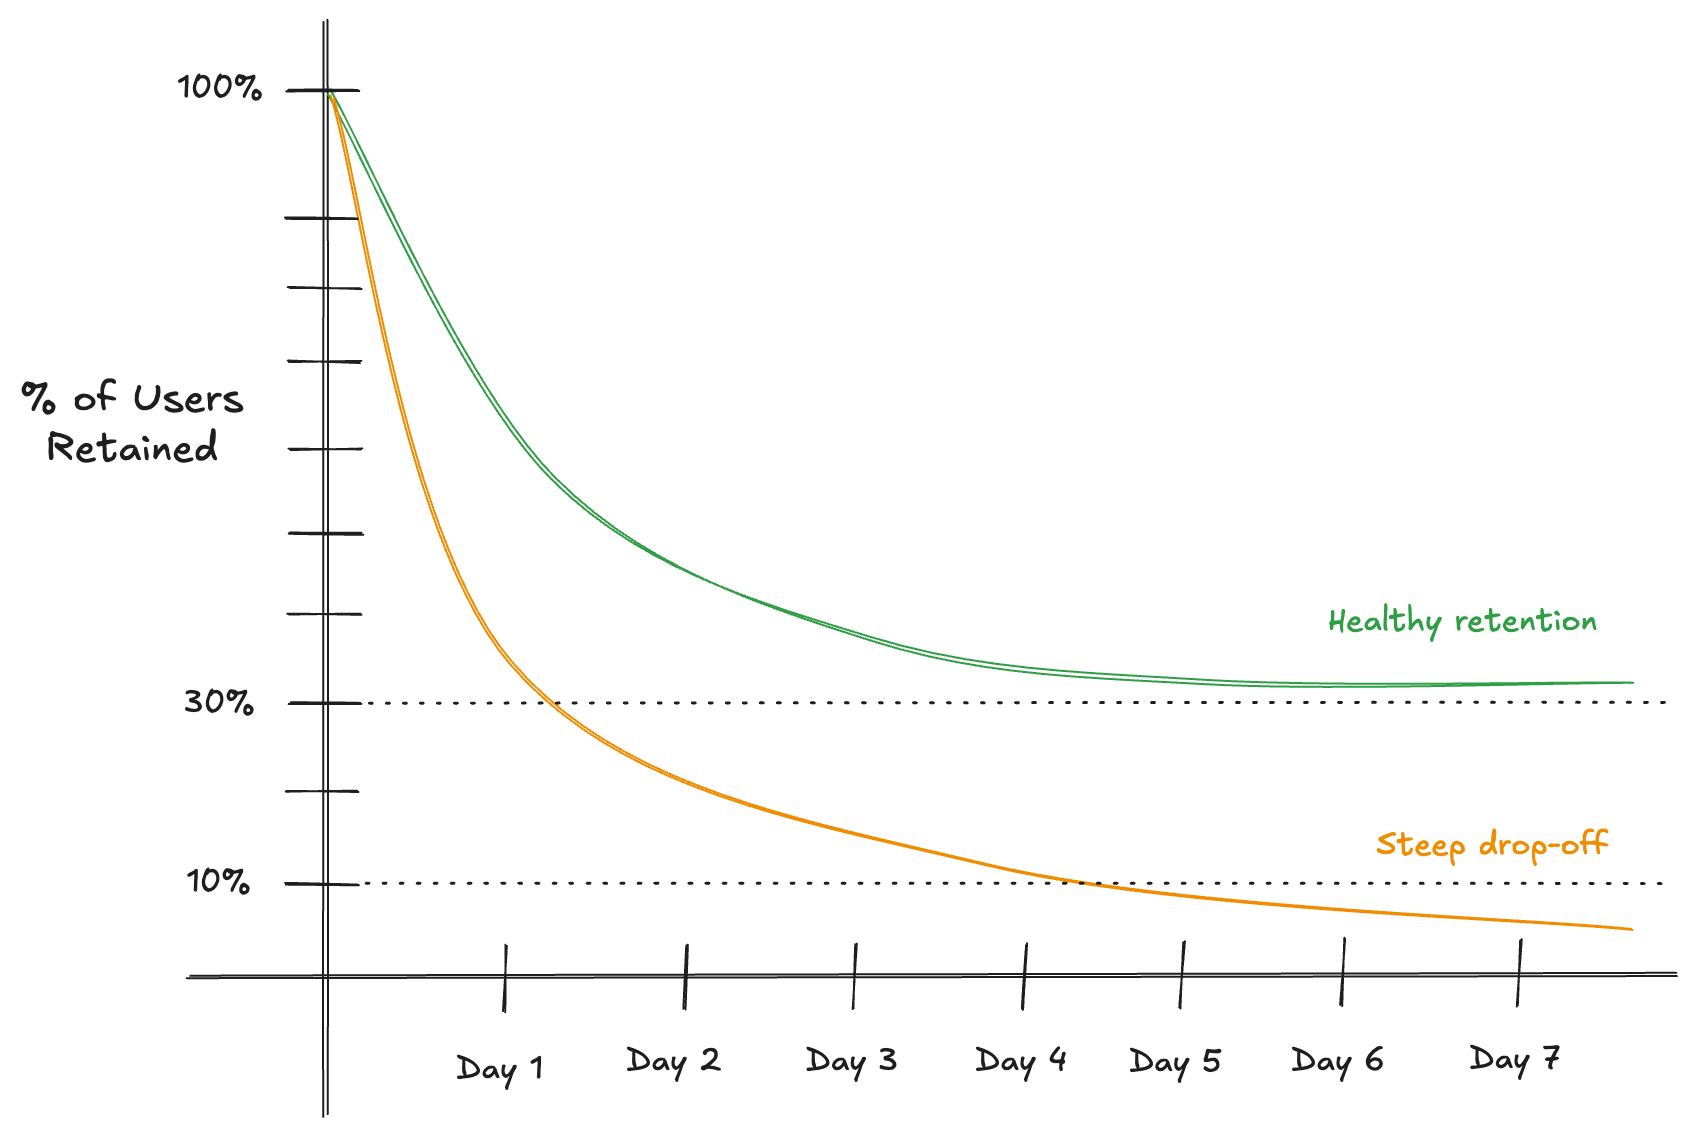
A product with strong PMF has a retention curve that flattens at a healthy level (in the example above it is 30%), while a product without PMF shows a steep drop-off.
For example, for applications that aspire to be daily tools (e.g., task tracking) or habits (e.g., Instagram) for users, there are three important retention indicators:
Day 1 retention: Did users come back after their first visit?
If not: Users don’t see value fast enough during the onboarding.
Day 7 retention: Are users integrating the product into their daily flow?
If not: The product might be too complicated to use.
Day 30 retention: Are users still engaged after a month?
If not: Maybe the product doesn’t deliver ongoing value.
To measure retention, find an event or events that indicate the real usage of your applications and track them using the same methods I described in the previous section (Amplitude, GA, Tableau, etc.).
If we take a task-tracking app as an example, it can be “Tack created”, or “Task status changed”. Tracking events as sign-in or loading the home page isn’t enough because they do not indicate in any way that the product brings value to users.
💡 Actionable Tip
Find the main action that drives retention. Example for a task-tracking app: “Users who successfully create and finish a task within 3 days of sign-up are 5x more likely to retain”.
If you identify this pattern, optimize the product to drive more users toward that action. Make that user flow easier to find and execute.
For example, include a non-obtrusive in-product guide (e.g., via Pendo.io) to point users to this action.
3. Performance & Usability: Are Technical Issues Blocking Adoption?
🎯 Why This Matters
Even a product with perfect PMF will fail if performance issues, bugs, or bad UX frustrate and drive users away.
As engineers, we have direct control over removing technical blockers.
📈 How to Measure It
If high-value user actions have high error rates, PMF is at risk. For example if 5% of users experience an error when trying to checkout, fixing that bug could boost revenue instantly.
DataDog is de-facto an industry SaaS standard for observability. Monitoring error rates through custom metrics or crashes through error tracking is easy to set up either by hand in their app, or via Terraform using their provider.
As en example, formula for measuring success rate can be done as:
The second area to focus on is performance and latency. Even as simple as 0.85 second reduction in page load time can bump conversion by 7% [source].
Percentile metrics are a great way how to assess user experience and measure time users spent waiting on the system to respond:
💡 Actionable Tip
Identify 2-5 main high-value user flows and set up alerts for their reliability and performance spikes.
At the same time, set up also monitoring for percentage of unfinished flows indicating drop-off rate, which can be caused not only by the product offering, but also by technical errors:
Summary
Most engineers focus on shipping features and optimizing code, but it’s not enough. The best engineers ensure what they build actually matters.
If people aren’t adopting a feature, it’s either unnecessary, confusing, or has friction.
To measure PMF effectively here’s a 3-step approach you can use:
1️⃣ Before launching a feature: Define what success looks like, e.g., 30% of new users should be still active users after 7 days.
2️⃣ After launching: Use event tracking, funnel analysis, and A/B testing to measure impact.
3️⃣ Iterate: If results are low identify why or create a hypothesis, then iterate and experiment.
📖 Read Next
Discover more from the Product Engineering track:
From Liability to Leverage: Turning Technical Debt Into Investment

You’re racing against a deadline, juggling several urgent tasks. Your manager asks for status twice a day, and the pressure to deliver as soon as possible is mounting.

If you’re looking for a space where you can learn more about software engineering, leadership, and the creator economy, with Dariusz Sadowski, Michał Poczwardowski, and Yordan Ivanov 📈, we’ve created the Engineering & Leadership discord community:
📣 Recommended Reading
Managing people you don't like by Anton Zaides and Rafa Páez in Leading Developers
15 lessons from 15 years in tech by Gregor Ojstersek and Owain Lewis in Engineering Leadership
Mentoring doesn't solve all problems. The 4 people every software engineer needs to grow fast without burnout by Fran Soto in Strategize Your Career